
SESOIL Use
The SESOIL Model
Model Input Data
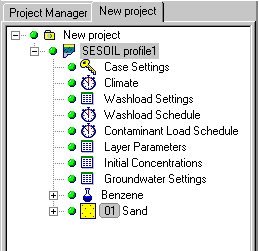
The figure below shows the Project Data Tree structure for a SESOIL model profile. The data structure is designed such that each branch of the tree groups together the common elements of the model input data. To view or modify the input parameters, simply right-click on the parameter group in the Project Data Tree and a data input form will appear as shown in the following section.
Project Properties
The Project Properties are primarily descriptive in nature. However, the Project Properties allow you to define the units for each of the parameters used in the model, and gives you the option of using two different sets of units; one set of units for the input data; and another set of units for the display of results. This is particularly useful when the field data you collect contains different units than you would like to display in the final report. The Unit Templates that you define for one project can be saved and utilized for many different projects in the future.


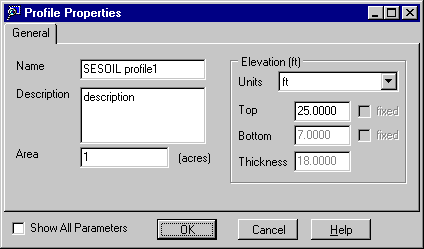
Profile Properties
The Profile Properties describes the name of the profile, the surface area it represents, and the top elevation of the profile (usually ground surface elevation). The bottom elevation and thickness of the profile can be viewed/modified in the Layer Properties parameter group.
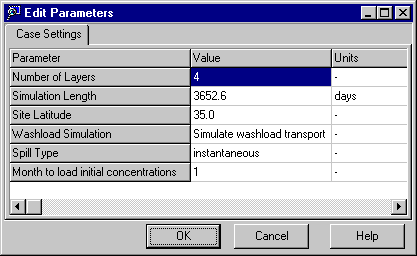
Case Settings
The Case Settings allow you to describe some of the general model conditions including:
- Number of layers (1 to 4)
- Simulation Length (time)
- Site Latitude
- Washload Simulation (yes/no)
- Spill Type (continuous/instantaneous)
- Month to load initial concentrations
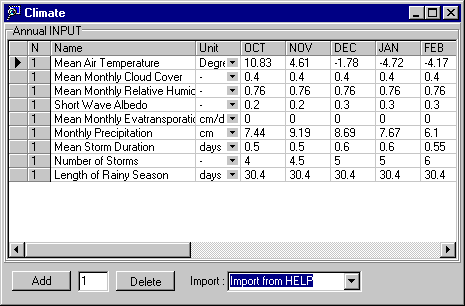
Climate Data
The Climate Data requires monthly statistics for both rainfall and evapotranspiration for each year of the simulation. Since this data is often difficult to obtain and tedious to enter, UnSat Suite provides a direct link to the Weather Generator for importing simulated data for the most important data including Mean Air Temperature, Total Monthly Precipitation and Number of Storms (default values provided by SESOIL are included for the remaining climate parameters).
Washload Settings
The Washload Settings define the static physical setting and soil properties for the contaminant loading area. These parameters do not change with time or according to climatic conditions.

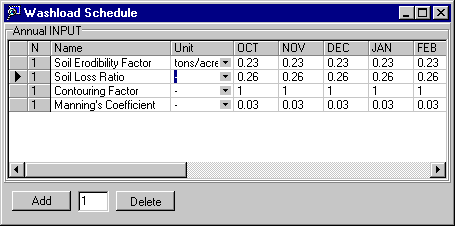
Washload Schedule
The Washload Schedule describes the dynamic physical properties of the contaminant loading area which can change with time or according to climatic/seasonal conditions.
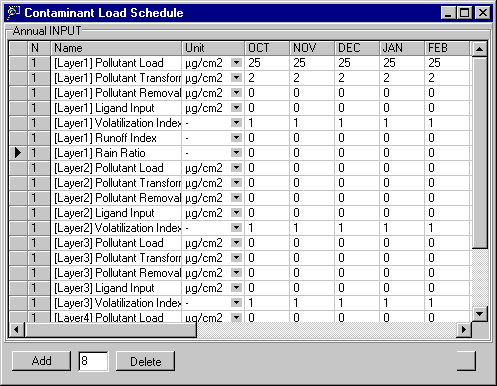
Contaminant Load Schedule
The Contaminant Load Schedule describes the contaminant loading parameters for each layer of the model, for each month, for each year of the simulation.
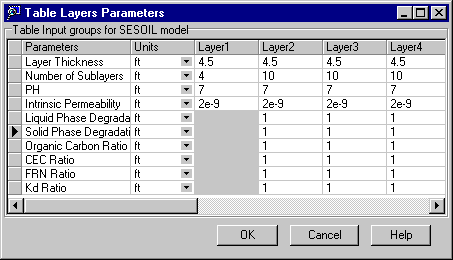
Layer Properties
The Layer Properties describe both the physical geometry and static chemical properties of the model profile. The total thickness (and depth) of the model profile is controlled by the thickness of each individual layer in the model. Each model layer can have up to 10 sublayers to provide a more detailed resolution of the simulation results.
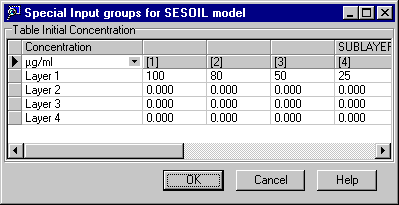
Initial Concentrations
The initial concentrations can be defined for each layer and sublayer of the model profile.
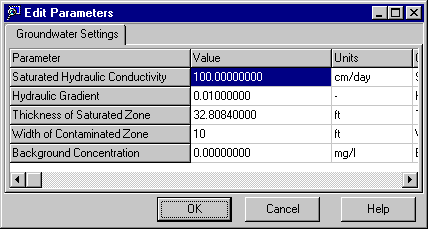
Groundwater Settings
The Groundwater Settings define the properties of the underlying saturated soil zone.
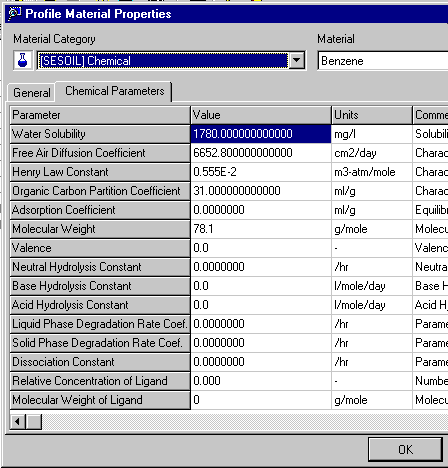
Chemical Properties
The Chemical Properties define the relevant chemical properties for the contaminant being simulated with the SESOIL model. UnSat Suite provides a database of chemical properties for 23 common contaminants of concern.
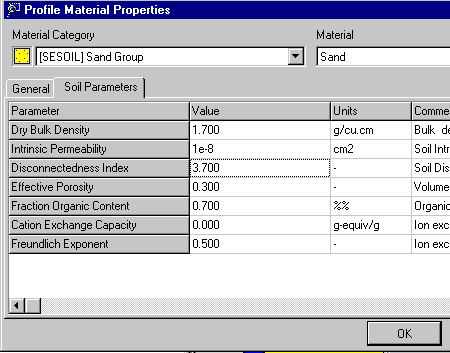
Soil Properties
The Soil Properties describe the physical flow properties of the soil material in the unsaturated zone. These properties are static and are not variable with depth.
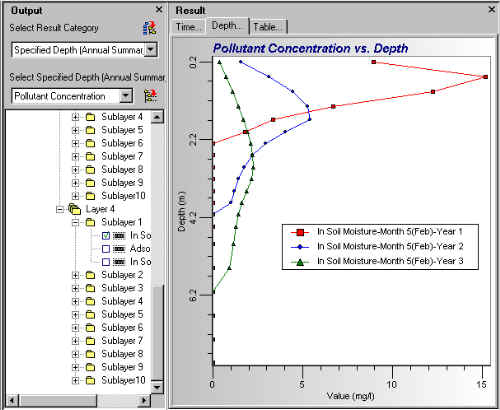
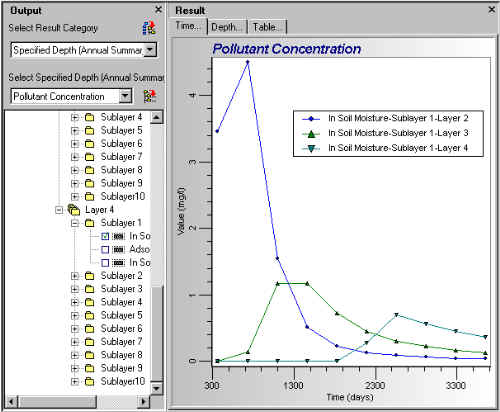
Display and Reporting of Model Results
The SESOIL model creates an output file containing monthly results for each layer and sub-layer of the model including:
- Hydrologic cycle components
- Pollutant mass distribution adsorbed on the soil
- Pollutant concentration distribution in soil moisture
- Pollutant concentration distribution in soil vapor
UnSat Suite comes with a powerful charting component that allows you to plot the modeling results using:
- Time-series plots of modeling data for multiple profile depths, and
- Depth-series plots of modeling data for multiple output times
These graphs can be printed to any printer or plotter supported by Windows. The print options allow you to create a customized page layout with a plot title, a description of the plot, and your company name and logo.
An automatic report generator creates a rich text document with a detailed summary of the model input data and selected graphs from the results.
Export Data To Visual MODFLOW
SESOIL modeling results can be used in conjunction with a saturated groundwater model to estimate recharge to the water table or to predict contaminant loading rates at the water table. UnSat Suite exports the SESOIL modeling results to an ASCII text file in a format that can be easily imported into Visual MODFLOW for either recharge boundary conditions, or for contaminant loading rates.