![]() Running BIOSCREEN and BUSTR-Screen Data in AT123D
Running BIOSCREEN and BUSTR-Screen Data in AT123D
![]() Establish Default AT123D Model Input Parameters
Establish Default AT123D Model Input Parameters
Groundwater Transport and Fate Model
AT123D is a generalized three-dimensional groundwater transport and fate model. AT123D is an acronym for Analytical Transient 1-, 2-, and 3-Dimensional Simulation of Waste Transport in the Aquifer System. It simulates contaminant transport under one-dimensional groundwater flow. Transport and fate processes simulated include advection, dispersion, diffusion, adsorption and biological decay. Contaminant transport can be simulated:
- Without biological decay, or
- With biodegradation simulated as a first-order decay process.
Version 6.3 of AT123D can simulate over 10,000 years of contaminant transport and contains a correction to the steady state algorithm.
Establish Site-Specific Cleanup ObjectivesAT123D can model the time-dependent contaminant releases from the SESOIL vadose zone model. AT123D was enhanced to simulate up to 1,000 years of contaminant migration when linked to SESOIL. Results can be used to estimate how far a contaminant plume will migrate and can be compared to groundwater standards to evaluate risk at specific locations and times. AT123D is an analytical model. This means that contaminant concentrations are determined independently for each node and there is no need to establish a dense grid network of nodes.
HistoryAT123D was developed by G. T. Yeh (1981) at Oak Ridge National Laboratory. Significant modifications to the version included with SEVIEW, were made by John Seymor (1982), Darryl Holman (1984) and Howard Trussell, (1986) of the University of Wisconsin-Madison. An enhanced version of AT123D which can simulate over 10,000 years of contaminant transport was created by R. A. Schneiker (2003) at ESCI. This version 6.3 of also includes a correction to the steady-state calculation.
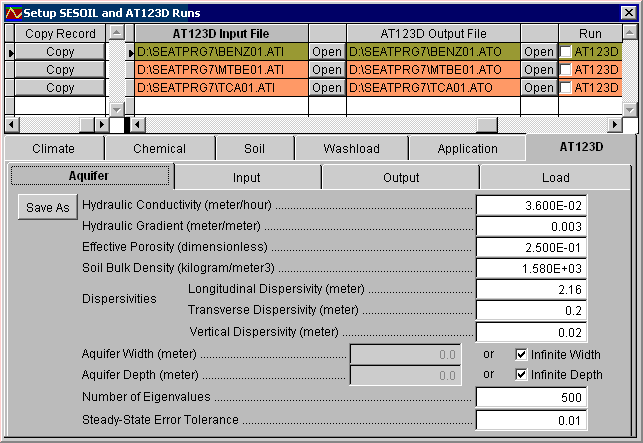
All AT123D Parameters on One Screen
SEVIEW provides a link between SESOIL and the AT123D groundwater transport and fate model. The link combines user-defined default input parameters with the SESOIL model results. As with SESOIL, you do not have to individually open and save each input file to setup the model. The AT123D input parameters are presented in tab-organized input screens which are linked to a journal. Changes are simply entered on the screens and are automatically saved. Quality control is also improved because the input parameters can be quickly scanned. SEVIEW automatically converts units between SESOIL and AT123D. SEVIEW 6.3 can also be used to setup and run AT123D independent of SESOIL.
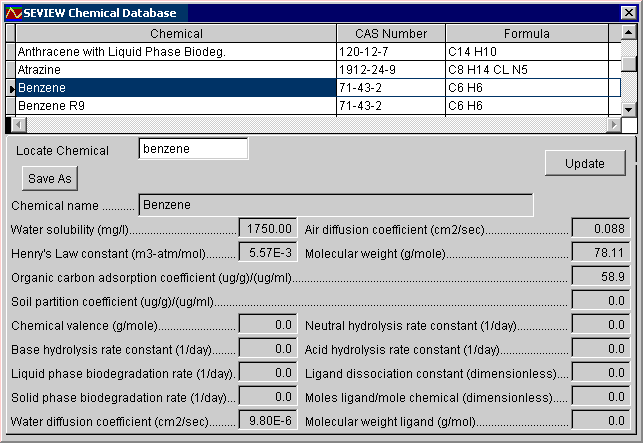
Chemical Database
SEVIEW includes a 593 record database for 193 chemicals. This database includes: CAS registry number, chemical formula, water solubility, air diffusion coefficient, water diffusion coefficient, Henry's Law constant, organic carbon adsorption coefficient, molecular weight and liquid phase biodegradation rate data.
Running BIOSCREEN and BUSTR-Screen Data in AT123D
SEVIEW can now be used to run BIOSCREEN and BUSTR-Screen simulations in AT123D. Although these models use almost identical input parameters the resulting groundwater concentrations typically differ by one to three orders of magnitude. This means that you can significantly reduce your remediation costs just by using AT123D. This doesn't mean that BIOSCREEN and BUSTR-Screen are the more conservative models. Although BIOSCREEN and BUSTR-Screen produce higher downgradient concentrations it often takes significantly longer to reach them. For example according to BIOSCREEN it would take MTBE in a silty aquifer 245 years to reach the maximum concentration at a point 350 feet downgradient. While AT123D predicts it would take only 94 years. There are several reasons for this but, the principal reasons are associated with contaminant load and the processes used to simulate contaminant transport.
Contaminant LoadGroundwater contamination typically exists as a three dimensional plume consisting of a width, breadth, and depth. However, BIOSCREEN and BUSTR-Screen only use the depth and width perpendicular to groundwater flow. The third dimension along the x-axis is assumed to be infinite (Figure 1). This was not done because it is difficult to establish the x-axis distance in the field. Nor was it done because it is conservative. Instead it was done to improve computational speed. Contaminant load in AT123D is established in all three dimensions.
Figure 1 Contaminant Load in BIOSCREEN, BUSTR-Screen and AT123D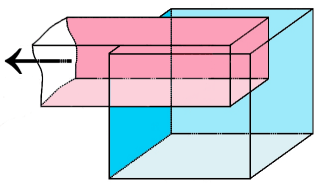
Contaminant Transport Processes
Analytical models like AT123D, BIOSCREEN and BUSTR-Screen use mathematical equations to simulate transport and fate processes. Common transport and fate processes include advection, dispersion, diffusion, adsorption and biological decay. Diffusion is the process by which contamination migrates from areas of higher concentration to areas of lower concentration even if there is no groundwater flow (Figure 2). Although not considered an important transport process in sand and gravel aquifers it can become the dominant process in silts and clays. However, BIOSCREEN and BUSTR-Screen do not simulate the diffusion process. This process was not left out because it is conservative to do so. In fact leaving it out actually reduces the rate of contaminant migration. Nor was it left out because it is difficult to find chemical diffusion values. It was left out simply to improve performance.
The Need for SpeedThe BIOSCREEN and BUSTR-Screen programs simplified modeling to the point where anyone could do it, however the speed and ease of use came at a price. BIOSCREEN was released in 1996 and was designed to run on a PC unlike traditional models which were designed to run on mainframe computers. Of course by the mid 90's PC versions of AT123D and other mainframe models were available. Still these models were not as easy as BIOSCREEN to use and often took hours or days to run on a PC.
The Next StepToday's powerful computers have improved the performance of AT123D to the point where it often takes only a few seconds to run. However, it was still difficult to setup. SEVIEW provides the next step by using the familiar BIOSCREEN and BUSTR-Screen interfaces to run AT123D. Finally making AT123D just as easy to setup and run. Using AT123D provides greater confidence in the results as the model was designed to be used over a wider range of conditions.
Establish Default AT123D Model Input Parameters
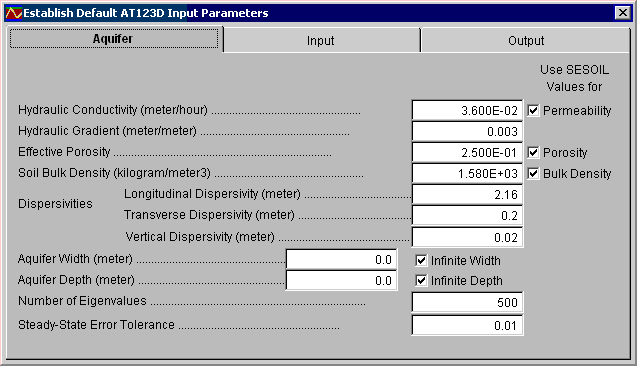
Default SESOIL-AT123D Link Parameters
The user can establish default AT123D input parameters. These parameters are combined with the SESOIL results to create AT123D input files. The AT123D input files are created whenever you print or preview a SESOIL Pollutant Cycle Report.
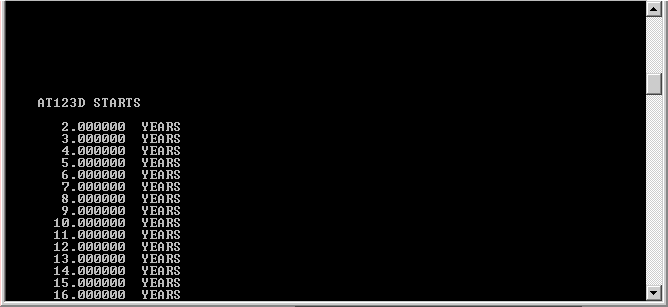
Running AT123D
When you run AT123D you will see the message "AT123D STARTS" followed by yearly information. When you click on the Run AT123D command in the navigator SEVIEW will run all completed AT123D scenarios. If the input or output files are left blank or if you did not check the run AT123D check box, SEVIEW will ignore the scenario.
Three AT123D Reports
SEVIEW produces three separate AT123D reports. The AT123D results can be viewed as animated area or centerline plots. Or you can view contaminant concentrations through time at specific locations. These reports present trends in groundwater concentrations that can be compared to groundwater standards.
Animated Area Concentration Report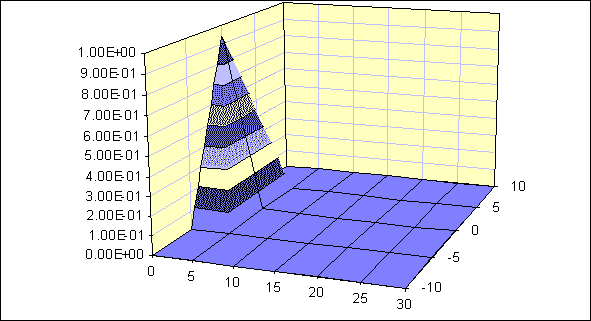
AT123D Area Report
The AT123D area report displays animated contaminant plume concentrations for the entire area modeled. This report also contains tabulated model results and a summary of the input parameters. A copy of the report at any time step can be printed.
Animated Centerline Report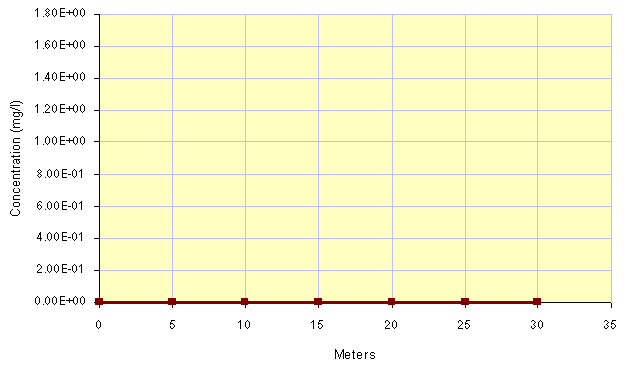
AT123D Centerline Report
The AT123D centerline report displays animated contaminant concentrations through the center of the plume. This report also contains a table of the results and a summary of the input parameters, in addition to the graphs. As with the area report, the user can print select time steps.
Point of Compliance Report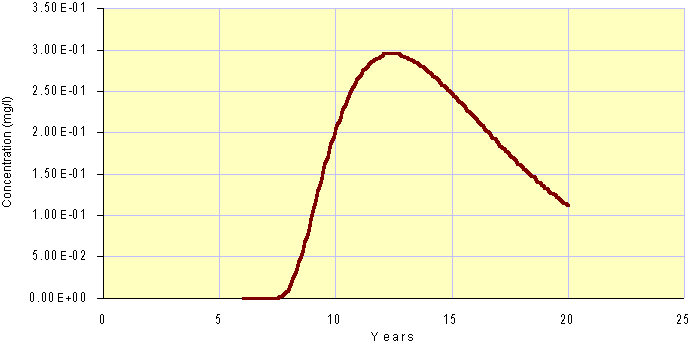
AT123D Point of Compliance Report
The AT123D point of compliance, report presents trends in groundwater concentrations at a single point such as a groundwater monitoring well or property boundary. This report can be generated at any of the three-dimensional points modeled. As with the other AT123D reports, this report contains a summary of the input parameters.